Categories Posted inin GeoInformation Layer Visibility in the Google Earth EnginePosted byby 0 Comments1 min 1 min Share This blog is a continuation of the Google Earth Engine Explorer Series, and we focus on the added... Continue Reading 1 min
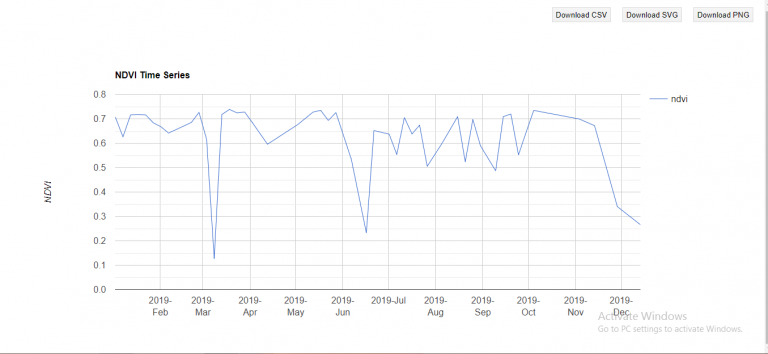
Categories Posted inin Tutorials NDVI Time series in Google Earth EnginePosted byby 1 Comment1 min 1 min Share The Normalized Difference Vegetation Index (NDVI) is a spectral index used to quantify the greenness of vegetation. Earlier... Continue Reading 1 min
Categories Posted inin GISTutorials Loading data in Jupyter notebooksPosted byby 0 Comments2 min 2 min Share A Jupyter notebook is a document that allows one to write code, notes and explanations as well as... Continue Reading 2 min
Categories Posted inin GISGIS Programming Display WMS from GeoServer on Leaflet using Vue.jsPosted byby Risper Mutinda2 Comments2 min 2 min Share The Web Map Service (WMS) is an Open Geospatial Consortium (OGC) specification that defines an HTTP interface used... Continue Reading 2 min
Categories Posted inin GISTutorials How to apply SLD in GeoServerPosted byby Risper Mutinda0 Comments2 min 2 min Share This tutorial will focus on outlining step by step process of applying a style on a layer in... Continue Reading 2 min
Categories Posted inin GISWeb GIS How to Publish a Shapefile in GeoServerPosted byby Risper Mutinda0 Comments2 min 2 min Share This tutorial focuses on how to publish a shapefile in Geoserver assuming that GeoServer is already installed and... Continue Reading 2 min
Categories Posted inin GISGIS Programming Display GeoJSON Data on Leaflet Map Using Vue JSPosted byby Risper Mutinda0 Comments2 min 2 min Share This article will focus on integrating Vue JS with Leaflet and outlining step by step process of displaying... Continue Reading 2 min
Categories Posted inin GIS Custom Icons using Leaflet and Vue JsPosted byby Risper Mutinda0 Comments2 min 2 min Share Custom icons are a great way to display map features, especially while representing point features. This article focuses... Continue Reading 2 min
Categories Posted inin GeoInformationTutorials Creating charts in Google Earth EnginePosted byby 0 Comments1 min 1 min Share Charts are used to represent data. They can be in different forms; such as pie charts, bar charts,... Continue Reading 1 min
Categories Posted inin GISTutorials Exporting vector data in GEEPosted byby 0 Comments1 min 1 min Share This blog shows how to export images from the Google Earth Engine (GEE). This is blog is a... Continue Reading 1 min
Categories Posted inin Tutorials Computation of Principal Component Analysis in GEEPosted byby Risper Mutinda2 Comments3 min 3 min Share Principal component analysis (PCA) is a technique applied to hyperspectral and multispectral data acquired through remote sensing. PCA... Continue Reading 3 min
Categories Posted inin GeoInformationTutorials Adding legends in GEEPosted byby 1 Comment1 min 1 min Share The following post is a step-by-step guide for adding legends in GEE. A legend is a quick guide... Continue Reading 1 min