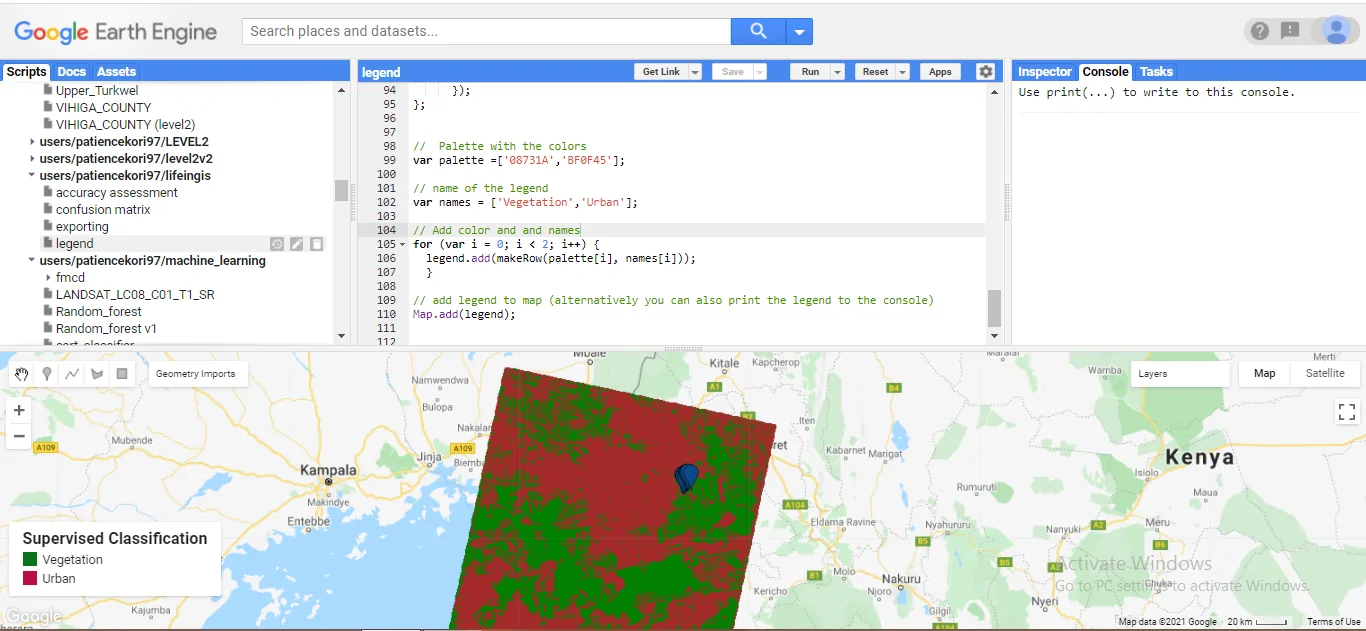
The following post is a step-by-step guide for adding legends in GEE. A legend is a quick guide and easy roadmap to enable the identification of the outputs of a particular analysis or study. In this blog, a legend is created for the supervised classification we did earlier.
- Create the legend title and style it. By styling one can include the font type, font size and font weight among others.
var legendTitle = ui.Label({
  value: ' Supervised Classification',
  style: {
    fontWeight: 'bold',
    fontSize: '18px',
    margin: '0 0 4px 0',
    padding: '0'
    }
});
- Add the title to the panel.
legend.add(legendTitle);- Create the row of the legend. The row will have the color and name of the items to be included in the legend, in this case urban and vegetation.
var makeRow = function(color, name) {
      var colorBox = ui.Label({
        style: {
          backgroundColor: '#' + color,
          // Use padding to give the box height and width.
          padding: '8px',
          margin: '0 0 4px 0'
        }
      });
- Create the description text for the colored box.
      var description = ui.Label({
        value: name,
        style: {margin: '0 0 4px 6px'}
      });

      // return the panel
      return ui.Panel({
        widgets: [colorBox, description],
        layout: ui.Panel.Layout.Flow('horizontal')
      });
};
- Create the palette for vegetation and urban
var palette =['08731A','BF0F45'];- Create the names to be displayed on the palette
var names = ['Vegetation','Urban'];- Add the color palette and names to the legend
for (var i = 0; i < 2; i++) {
  legend.add(makeRow(palette[i], names[i]));
  }
- Adding legends to the map.
Map.add(legend); - Below is a representation of the legend:


Have a good day! Thank you for code. I had firstly error because of in beginning we need to create this var
var legend = ui.Panel({
style: {
position: ‘bottom-left’,
padding: ‘8px 15px’
}
});