Principal component analysis (PCA) is a technique applied to hyperspectral and multispectral data acquired through remote sensing. PCA converts an original correlated image into a smaller image with uncorrelated variables. These variables represent most of the information existing in the original image or dataset. PCA reduces the dimensions of data. When PCA is done on an image, it reduces the number of bands. The information is converted into fewer uncorrelated variables, which are the principal components.
The resulting output has 3 principal components; PC1, PC2 and PC3. The first principal component consists of most of the variance proportion of the original image. Hence carries most of the information. Therefore, the first principal component, PC1, is used in most analyses such as the extraction of surface features. PCA removes redundancy from the analysis. This article focuses on outlining step by step process of performing the Principal Component Analysis on a dataset.

Select an area of interest.
Firstly, choose an area of interest using the import into script option. The area of interest, in this case, is part of the Kenyan Coast.
Select an Image and the area of interest bounds.
Secondly, choose an image composite from your assets. After selecting the image, choose the region which the PCA will use.
var composite = ee.Image("users/mutindarisper/Pansharpened_L8_Image"); var boundary = ee.FeatureCollection("users/mutindarisper/Tiwi_Aquifer")Write a Function to calculate Principal Components.
Thirdly, write a function that will compute the principal components of the image.
function PCA(maskedImage){
  var image = maskedImage.unmask()
  var scale = 20;
  var region = boundary;
  var bandNames = image.bandNames();
  // Mean center the data to enable a faster covariance reducer
  // and an SD stretch of the principal components.
  var meanDict = image.reduceRegion({
    reducer: ee.Reducer.mean(),
    geometry: region,
    scale: scale,
    maxPixels: 1e9,
    bestEffort: true,
    tileScale: 16
  });
  var means = ee.Image.constant(meanDict.values(bandNames));
  var centered = image.subtract(means);
  // This helper function returns a list of new band names.
  var getNewBandNames = function(prefix) {
    var seq = ee.List.sequence(1, bandNames.length());
    return seq.map(function(b) {
      return ee.String(prefix).cat(ee.Number(b).int());
    });
  };
  // This function accepts mean centered imagery, a scale and
  // a region in which to perform the analysis.  It returns the
  // Principal Components (PC) in the region as a new image.
  var getPrincipalComponents = function(centered, scale, region) {
    // Collapse the bands of the image into a 1D array per pixel.
    var arrays = centered.toArray();

    // Compute the covariance of the bands within the region.
    var covar = arrays.reduceRegion({
      reducer: ee.Reducer.centeredCovariance(),
      geometry: region,
      scale: scale,
      maxPixels: 1e9,
      bestEffort: true,
      tileScale: 16
    });
    // Get the 'array' covariance result and cast to an array.
    // This represents the band-to-band covariance within the region.
    var covarArray = ee.Array(covar.get('array'));
    // Perform an eigen analysis and slice apart the values and vectors.
    var eigens = covarArray.eigen();
    // This is a P-length vector of Eigenvalues.
    var eigenValues = eigens.slice(1, 0, 1);

    // Compute Percentage Variance of each component
    var eigenValuesList = eigenValues.toList().flatten()
    var total = eigenValuesList.reduce(ee.Reducer.sum())
    var percentageVariance = eigenValuesList.map(function(item) {
      return (ee.Number(item).divide(total)).multiply(100).format('%.2f')
    })
    // This will allow us to decide how many components capture
    // most of the variance in the input
    print('Percentage Variance of Each Component', percentageVariance)
    // This is a PxP matrix with eigenvectors in rows.
    var eigenVectors = eigens.slice(1, 1);
    // Convert the array image to 2D arrays for matrix computations.
    var arrayImage = arrays.toArray(1);
    // Left multiply the image array by the matrix of eigenvectors.
    var principalComponents = ee.Image(eigenVectors).matrixMultiply(arrayImage);
    // Turn the square roots of the Eigenvalues into a P-band image.
    var sdImage = ee.Image(eigenValues.sqrt())
      .arrayProject([0]).arrayFlatten([getNewBandNames('sd')]);
    // Turn the PCs into a P-band image, normalized by SD.
    return principalComponents
      // Throw out an an unneeded dimension, [[]] -> [].
      .arrayProject([0])
      // Make the one band array image a multi-band image, [] -> image.
      .arrayFlatten([getNewBandNames('pc')])
      // Normalize the PCs by their SDs.
      .divide(sdImage);
  };
  var pcImage = getPrincipalComponents(centered, scale, region);
  return pcImage.mask(maskedImage.mask());
}
Select the first 3 principal components.
The first three components capture 97% of the information from the results. Select pc1, pc2 and pc3 then discard the rest.
var pca = PCA(composite).select(['pc1', 'pc2', 'pc3'])Add the 3 PCA bands to the original image.
Proceed to add the PCA bands to the original image. Use the addBands () method.
var composite = composite.addBands(pca) Display final results
Add the final results to the map.
Map.addLayer(pca, {bands: ['pc1', 'pc2', 'pc3']}, 'pca')
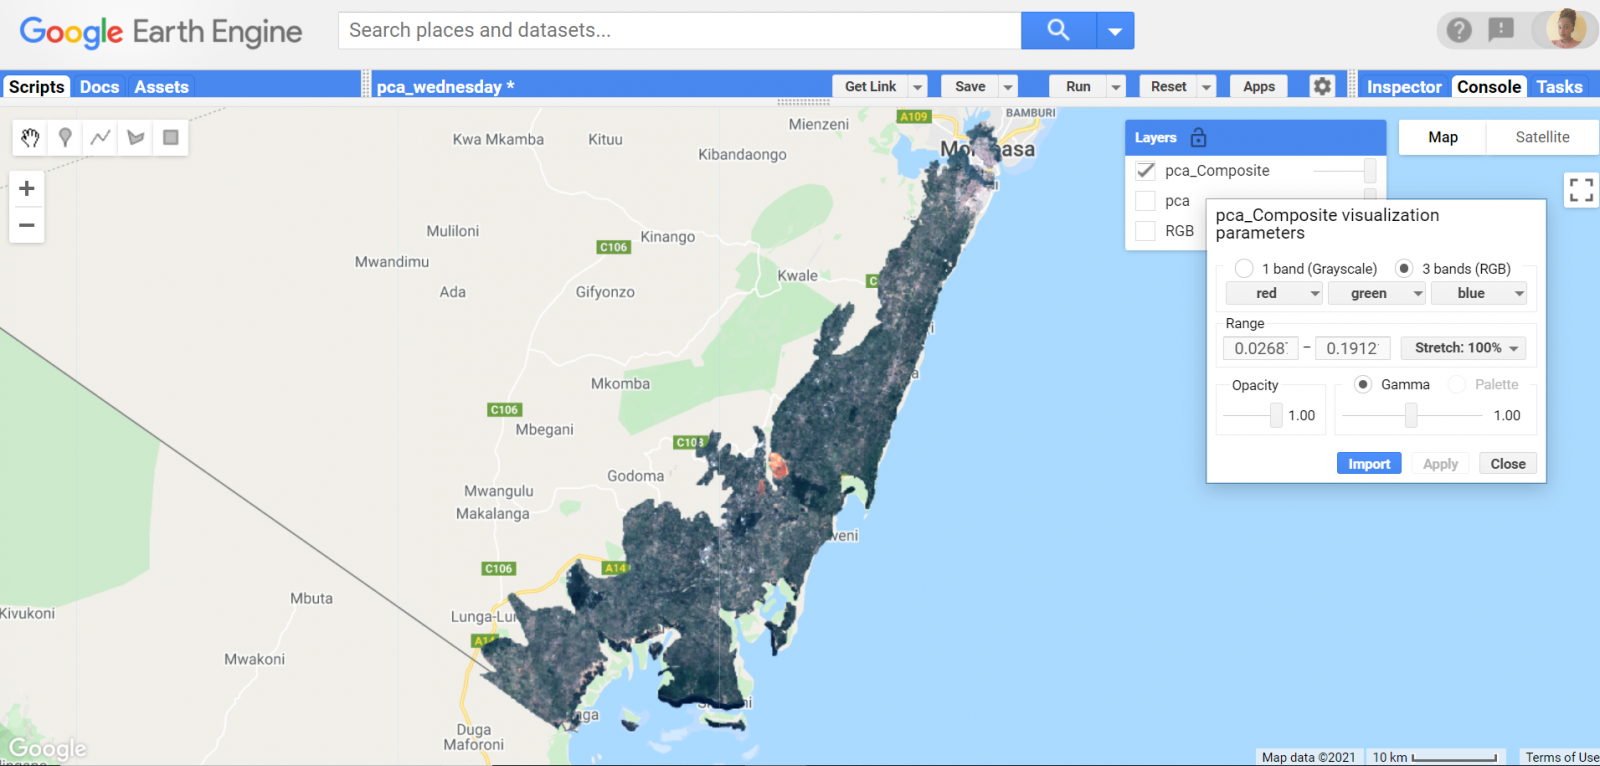
Map.addLayer(composite, {bands: ['red', 'green', 'blue']}, 'pca_Composite')
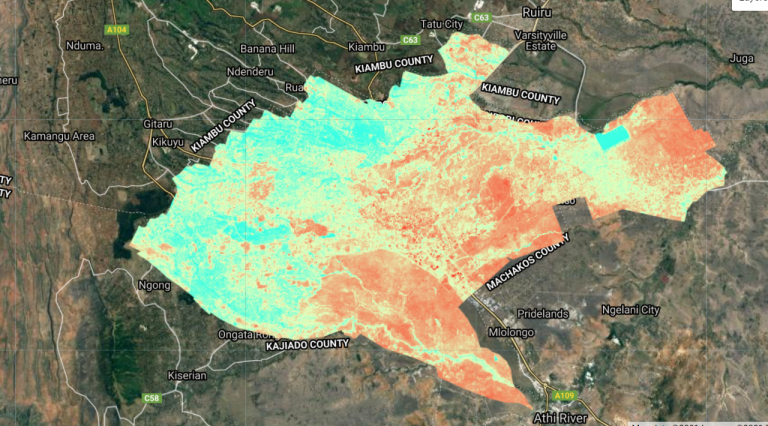
Principal Component Analysis
An image consisting of the three bands, i.e. the pc1, pc2 and pc3.
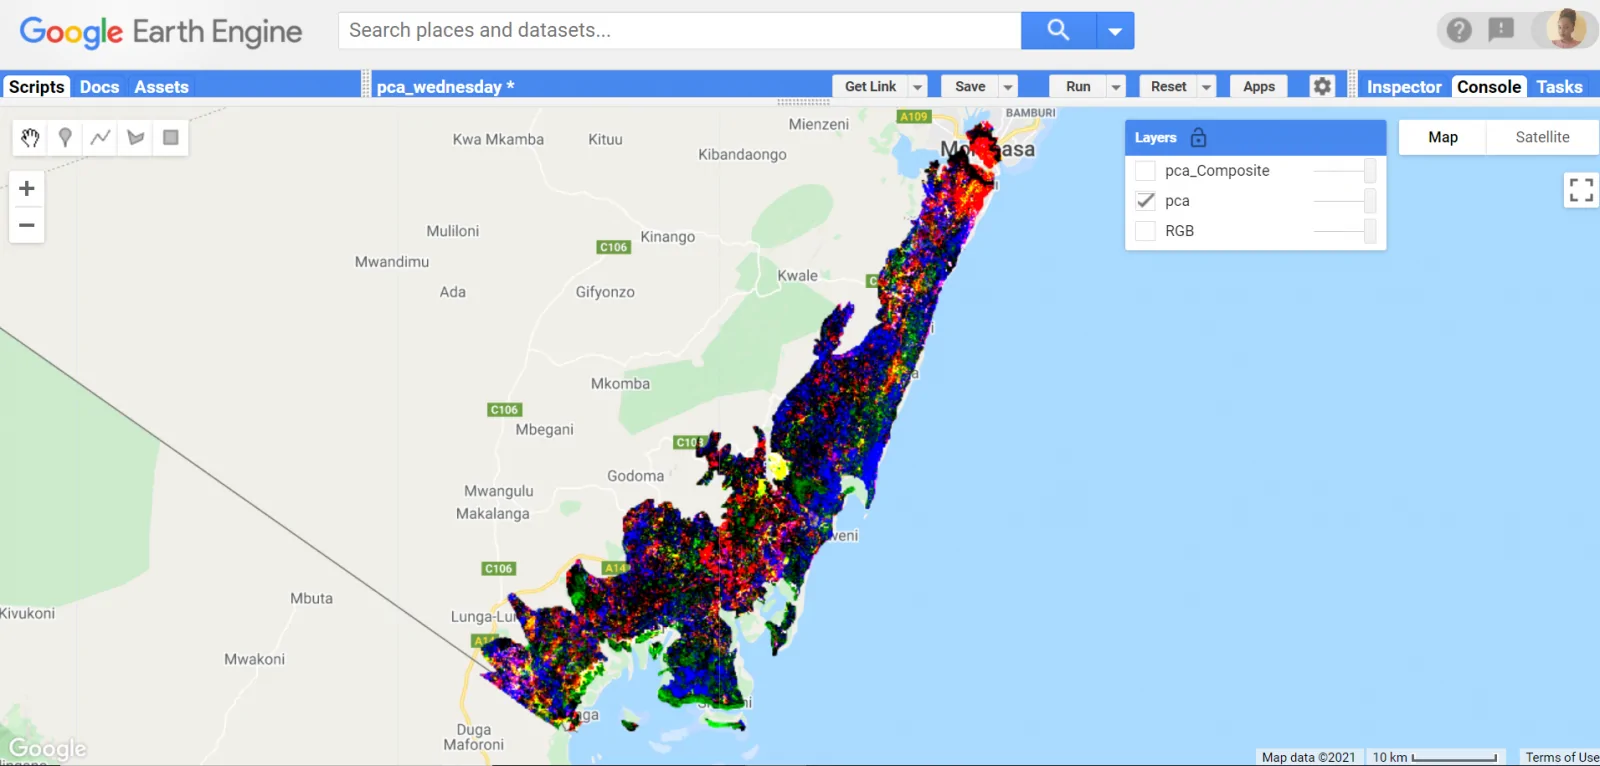
Principal Component Analysis Composite
An image consisting of six bands, i.e. the pc1, pc2, pc3, red, green and blue.


Hi Risper, thank you very much for this article, it is very useful.
I tried to compute the PC on two different datasets: 1)Sentinel-2 bands with some Vegetation indeces and 2)Sentinel-1 with some glcm texture bands. I am able to run the PCA function and I get the results, however, sometimes when trying to visualize the image in the map or when trying to export the image, I get a similar error as the one described by this user in StackExchange:
https://gis.stackexchange.com/questions/431513/gee-error-layer-1-tile-error-array-max-nan-cannot-be-less-than-min-nan
Do you know what could be the problem?
Thanks in advance
Hi Risper, thank you for this article. I have a question. If I want to calculate PCA for RSEI in GEE ( PC1[f(NDVI, WET, NDSI, LST)]), May I need to merge those indicators (NDVI, WET, NDSI, LST) in one band?