This article focuses on how to prepare and preview image collection, provides example code for collection visualization method, and time-series animation techniques.
Images composing an Image Collection can be visualized as either an animation or a time series animation of thumbnails referred to as a filmstrip. These methods provide a quick assessment of the contents of an ImageCollection and an effective medium for detecting spatiotemporal change.
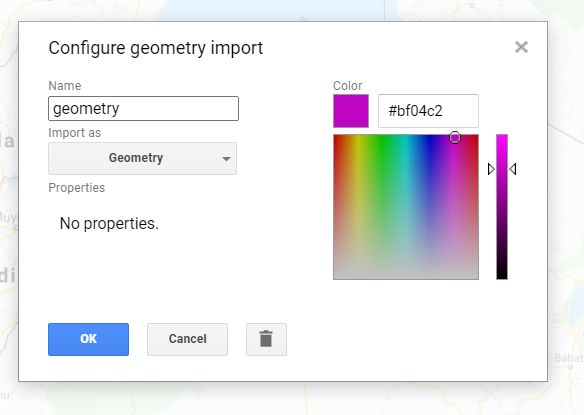
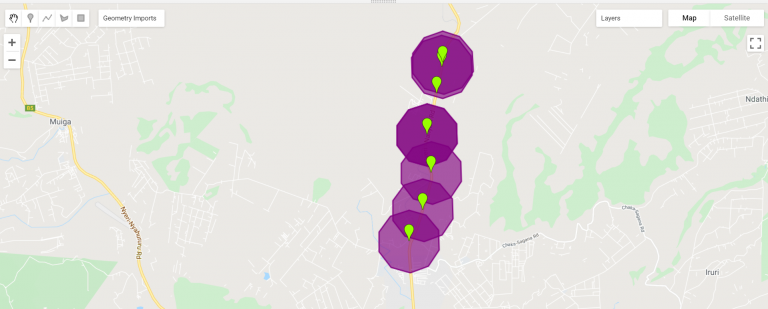
Select an area of Interest.
Select an area of interest using the geometry tool.
Choose an Image collection
Choose the dataset to be used. In this case, NDVI collection from MODIS dataset will be visualized using an animated GIF. Proceed to perform a filter for the dates, to obtain the date the image was acquired.
var collection = ee.ImageCollection("MODIS/006/MOD13Q1")
  .filterDate('2018-01-01', '2019-01-01')
  .select('NDVI');
Clip the first image to the area of interest and add it to the map
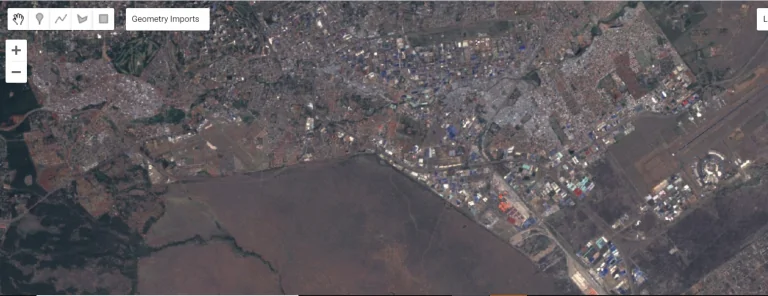
The first image in the collection is added to the map just as a preview.
var im = ee.Image(collection.first().clip(geometry));
Map.addLayer(im, {}, "first image");
Visualization
Apply visualization parameters to the animation.
var args = {
  crs: 'EPSG:3857',  // Maps Mercator
  dimensions: '300',
  region: geometry,
  min: -2000,
  max: 10000,
  palette: 'black, blanchedalmond, green, green',
  framesPerSecond: 12,
};
Create a video thumbnail and add it to the map
var thumb = ui.Thumbnail({
  image: collection,
  params: args,
  style: {
    position: 'bottom-right',
    width: '320px'
  }});
Display the final results
print(collection.getVideoThumbURL(args));
Map.addLayer(geometry);
Map.centerObject(geometry, 3);
Map.add(thumb);
NDVI Animation
Be sure to check the next post on Creating Buffers in GEE


Preview image collection using time-series