
What is NDBI?
Normalized Difference Built-up Index (NDBI) is a spectral index used to analyze built-up areas. This index uses two bands: the short-wave infrared (SWIR) and the near-infrared (NIR). Areas with more built-up structures reflect shortwave-infrared (SWIR) more while areas with less built-up have a low Near-Infrared (NIR) reflectance. NDBI values range from -1 to +1 where the negative values represent areas with no built-up structures and positive values represent highly built-up areas. This article focuses on the step-by-step process of computing NDBI using Sentinel 2 in Google Earth Engine.
Select an Area of Interest
You can choose an area of interest by importing a shapefile of the region you are interested in. To achieve this, proceed as follows:
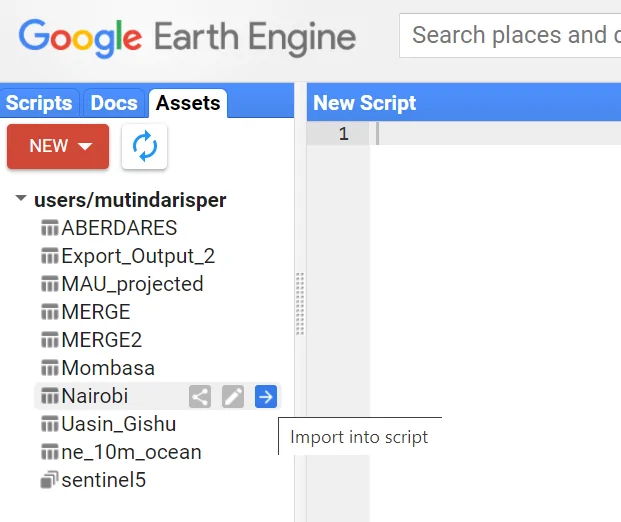
- On the left side panel, click on Assets
- A list of your previously ingested tables (shapefiles) will appear
- Navigate to your shapefile of interest and click on the arrow to import the shapefile into the script.
Select an image collection.
- In this case, an image from Sentinel 2 image collection from Copernicus was used. Perform a filter for the clouds so as to obtain an image with less cloud cover.
- Proceed to perform a filter for the dates, to obtain the date the image was acquired and a filter for bounds to obtain an image for your area of interest.
- Reduce the image collection to a single image by calculating the median of the pixel values.
var s2 = ee.ImageCollection(“COPERNICUS/S2”);
var filtered = s2.filter(ee.Filter.lt(‘CLOUDY_PIXEL_PERCENTAGE’, 30))
		.filter(ee.Filter.date(‘2019-01-01’,  ‘2019-12-31’))
		.filter(ee.Filter.Bounds(table));
var image = filtered.mean();
print (image);
Visualization
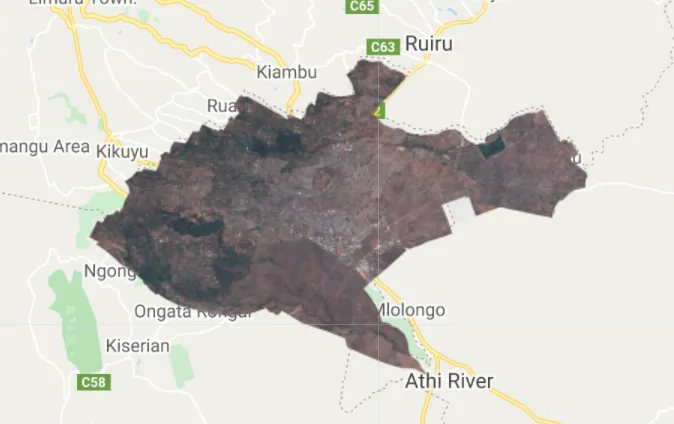
Apply a true colour visualization to the filtered image. This is achieved using B4, B3, and B2 which are Red, Green and Blue bands respectively.

var rgbVis = {
min: 0.00,
max: 3000,
bands: [‘B4’, ‘B3’, ‘B2’]
};
Calculate and Visualize NDBI
The NDBI is calculated using the normalised difference() function and bands B11 and B8.
Apply the visualization parameters to the NDBI layer.
var ndbi = image.normalizedDifference([‘B11’, ‘B8’).rename(‘ndbi’);
var ndbiParams = {
min: -1,
max: 1,
palette: [‘cyan’, ‘red’]
};
Display the Final Result
Map.addLayer(image.clip(table), rgbVis, ‘Image’);
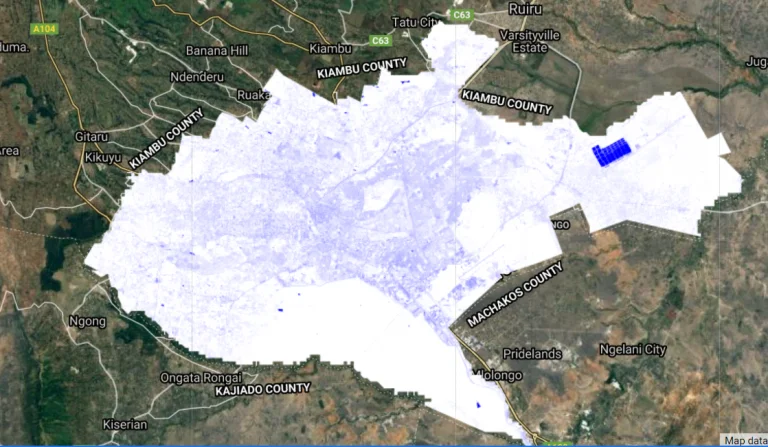
Map.addLayer(ndbi.clip(table), ndbiParams, ‘ndbi’);
Map.centerObject(table, 10);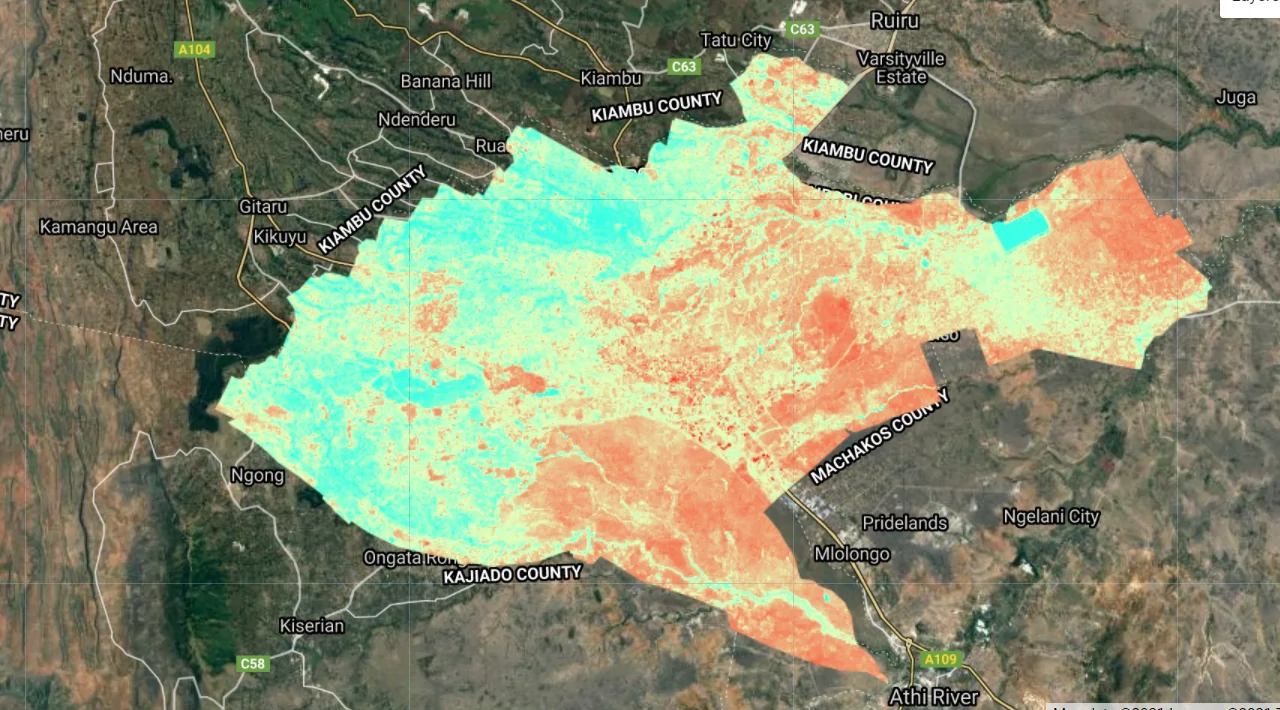
Central Business District (CBD), Estates and around the slums such as Kibera.


Hello Risper Mutinda,
I hope you’re doing well. Thank you for the detailed and insightful article on “Computing NDBI in Google Earth Engine.” It was incredibly helpful and aligns perfectly with my research interests.
I am currently working on a geospatial analysis project focusing on Riyadh, the capital of Saudi Arabia. I would like to apply the NDBI analysis you demonstrated in your article to this region. Could you kindly share the code or any additional tips that could help adapt the analysis to my area of interest?
I would be happy to acknowledge your contribution in my research and share the findings with you if you’re interested. Thank you for your time and for sharing such valuable resources!