What is MNDWI?
Modified Normalized Difference Water Index (MNDWI) is a spectral index used to analyze water bodies such as rivers, lakes and dams, especially in built-up areas since it can reduce or even remove built-up land. This index uses two bands: green and short-wave infrared (SWIR). MNDWI values range from -1 to +1 where the negative values represent areas with no water bodies and positive values >0.5 represent water bodies. As I have shown how to compute NDBI in GEE, this article focuses on step by step process of computing MNDWI using Sentinel 2 on Google Earth Engine.
Select an Area of Interest
You can choose an area of interest by importing a shapefile of the region you are interested in. To achieve this, proceed as follows:
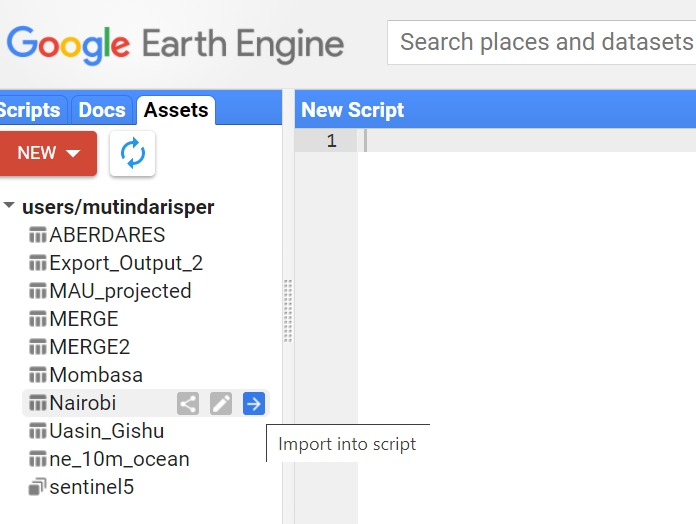
- On the left side panel, click on Assets
- A list of your previously ingested tables (shapefiles) will appear
- Navigate to your shapefile of interest and click on the arrow to import the shapefile into the script.
Select an image collection
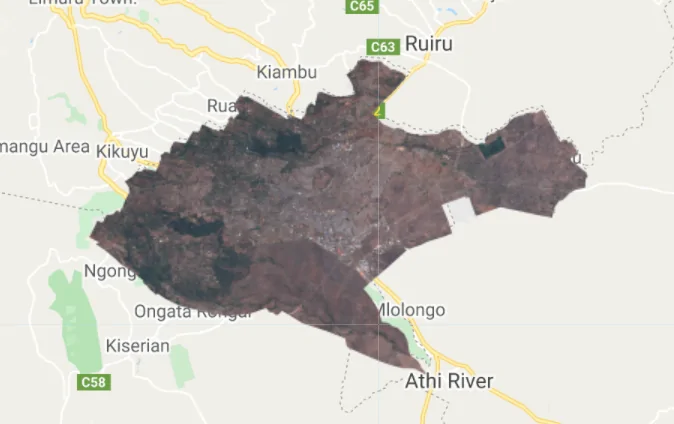
- In this case, an image from Sentinel 2 image collection from Copernicus was used. Perform a filter for the clouds so as to obtain an image with less cloud cover.
- Proceed to perform a filter for the dates, to obtain the date the image was acquired and a filter for bounds to obtain an image for your area of interest.
var s2 = ee.ImageCollection(“COPERNICUS/S2”);
var filtered = s2.filter(ee.Filter.lt(‘CLOUDY_PIXEL_PERCENTAGE’, 30))
		.filter(ee.Filter.date(‘2019-01-01’,  ‘2019-12-31’))
		.filter(ee.Filter.Bounds(table));
var image = filtered.mean();
print (image);
Visualization
Apply a true colour visualization to the filtered image. This is achieved using B4, B3, and B2 which are Red, Green and Blue bands respectively.

var rgbVis = {
min: 0.00,
max: 3000,
bands: [‘B4’, ‘B3’, ‘B2’]
};
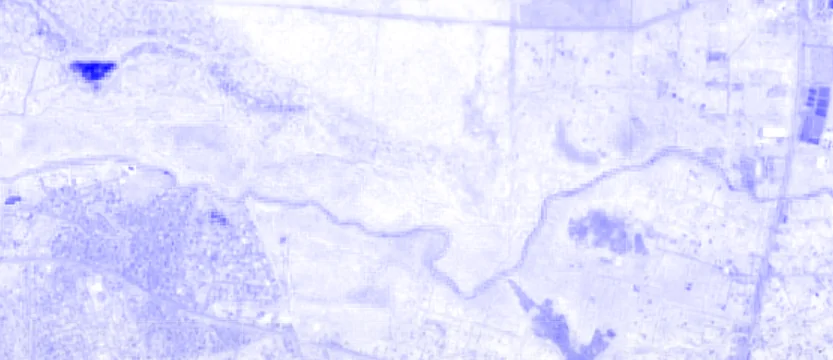
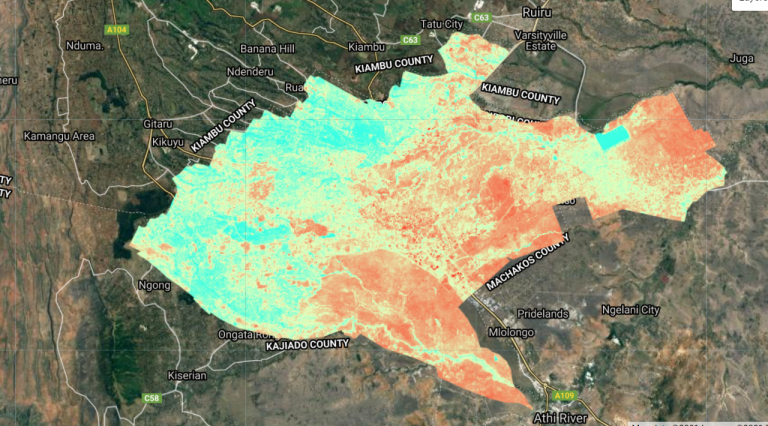
Calculate and Visualize MNDWI
The MNDWI is calculated using the normalizedDifference() function and bands B11 and B3.
Apply the visualization parameters to the MNDWI layer
var mndwi = image.normalizedDifference([‘B11’, ‘B3’).rename(‘mndwi’);
var mndwiParams = {
min: -1,
max: 1,
palette: [‘white’, ‘blue’]
};
Display the Final Result
Map.addLayer(image.clip(table), rgbVis, ‘Image’);
Map.addLayer(mndwi.clip(table), mndwiParams, ‘mndwi’);
Map.centerObject(table, 10);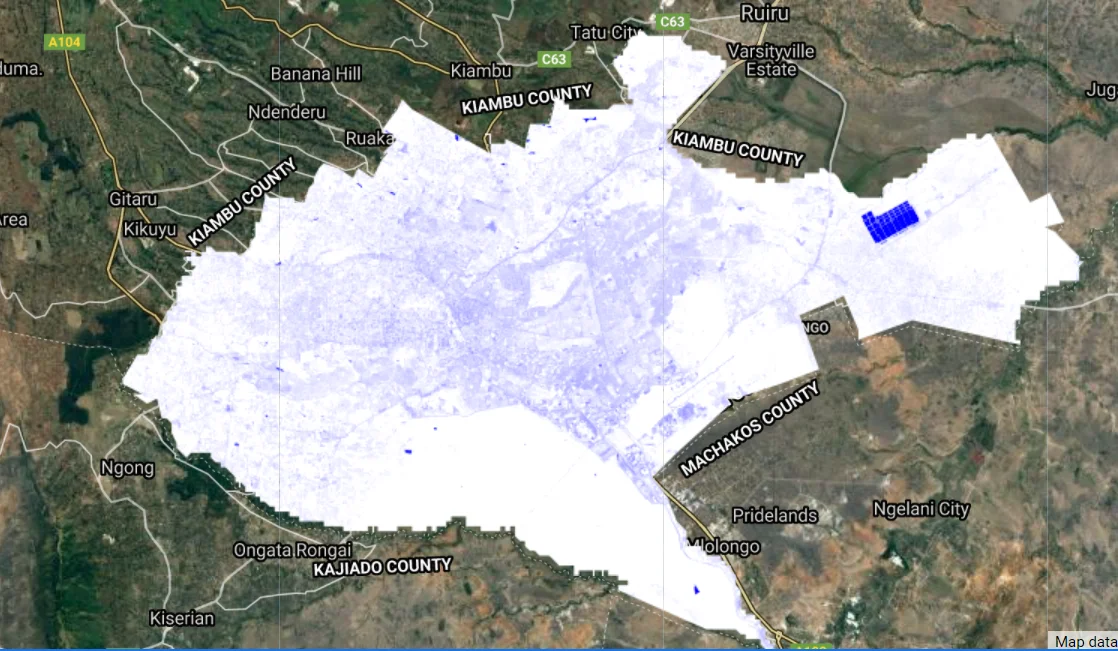
Analysis
The area of interest is Nairobi County. We expect to see major water bodies such as the Nairobi River and dams be enhanced despite being surrounded by built-up areas since Nairobi is highly urbanized.
Hi, great article!
It was really helpflu for me!
I had some questions, I would like to know if you could help me?!
To calculate the MNDWI it would be necessary to resampling the SWIR band? considering that it has 20m while the green band has 10m. Will this difference not influence the result?