Map projections play a crucial role in cartography and geographic information systems (GIS). However, they often perplex even the most seasoned professionals in the geospatial industry. In most cases, you have to refer back to the documentation and materials to recheck an issue.
Have you ever looked at a world map and wondered why Greenland appears larger than Africa, even though you know Africa is vastly bigger? This perplexing phenomenon, and many others, stem from the fascinating world of map projections. Maps, those seemingly straightforward tools for navigating our world, hold a hidden complexity – the way they depict our spherical Earth on a flat surface.
In this comprehensive guide, we will delve deep into the world of map projections, exploring their history, types, challenges, and practical applications. Whether you’re a GIS expert or someone new to the field, this article will provide valuable insights into understanding and navigating the complexities of map projections.
History of Map Projections
Map projections have a rich history dating back centuries. Early cartographers grappled with the challenge of representing the spherical Earth on a flat surface, leading to the development of various projection methods. Ancient maps, such as those from Babylonian, Egyptian, and Greek civilizations, often depicted geographic features in a stylized manner without adhering to rigorous mathematical principles.
One of the earliest known map projections is the cylindrical projection, attributed to the Greek mathematician and geographer Claudius Ptolemy in the 2nd century AD. Ptolemy’s work, “Geography,” introduced the concept of projecting the Earth’s spherical surface onto a cylinder tangent to the equator. While rudimentary by modern standards, Ptolemy’s cylindrical projection laid the groundwork for later developments in cartography.
In the 20th century, with the advent of computer technology and Geographic Information Systems (GIS), cartographers gained access to sophisticated tools for map projection design and analysis. This era saw the development of hundreds of new projection types, each tailored to specific applications and geographic regions. From equal-area projections like the Robinson projection to conformal projections like the Lambert Conformal Conic projection, cartographers had an expanding toolkit for representing the Earth’s surface in increasingly accurate and meaningful ways.
What Are Map Projections?
At its core, a map projection is a systematic transformation of the Earth’s three-dimensional surface onto a two-dimensional plane. The purpose of map projections is to create maps that preserve certain properties, such as distance, direction, shape, or area. However, no single projection can accurately preserve all these properties simultaneously, leading to inherent distortions.

Challenges with Map Projections
Despite their utility, map projections present several challenges that cartographers and GIS professionals must navigate:
- Spatial Distortions – Map projections inevitably introduce distortions in one or more spatial properties, such as area, shape, distance, or direction. No single projection can perfectly preserve all spatial properties simultaneously, leading to trade-offs and compromises depending on the intended use of the map.
- Projection Selection Complexity – The sheer variety of map projections available can be overwhelming, making it challenging to select the most appropriate projection for a given application. Cartographers must carefully consider the purpose of the map, the area of coverage, and the spatial properties to prioritize when choosing a projection.
- Misconceptions and Misinterpretations – Map projections are often misunderstood by the general public, leading to misconceptions about the shape and size of geographic features. For example, the Mercator projection’s distortion of polar regions can lead to misconceptions about the relative size of landmasses, perpetuating inaccurate perceptions of global geography.
- Software and Computational Constraints – Implementing certain map projections may require specialized software tools or computational resources. Complex projections or custom projection designs may pose challenges for cartographers working with limited technical expertise or access to advanced GIS software.
- Coordination and Compatibility Issues – Ensuring coordination and compatibility between different datasets and mapping applications can be difficult when working with multiple map projections. Translating data between different projections can introduce errors or inconsistencies if not done carefully, requiring meticulous attention to detail and coordination among stakeholders
Types of Map Projections
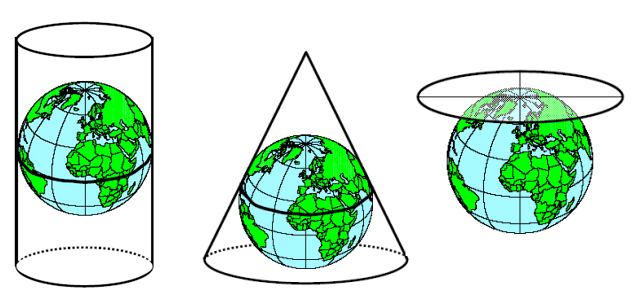
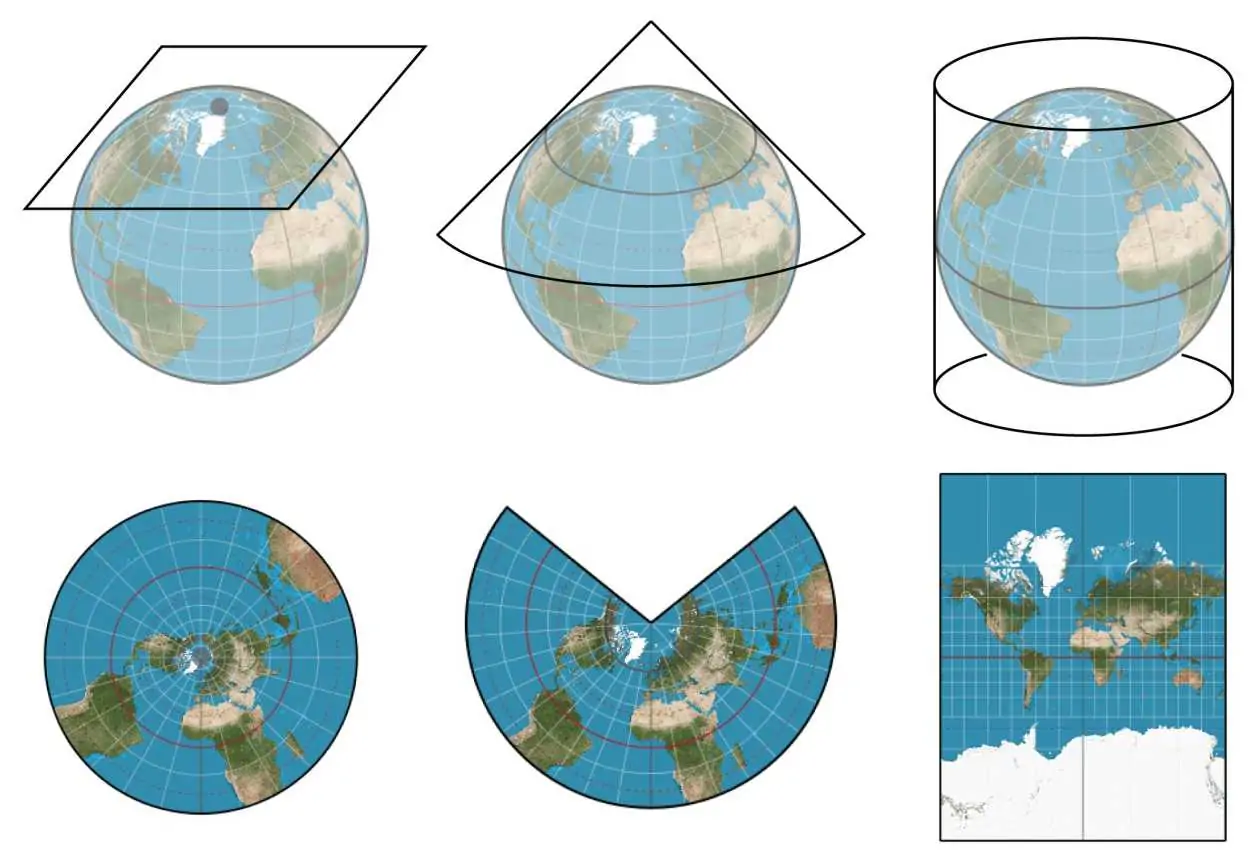
Map projections can be broadly categorized into three main types:
- Cylindrical
- Conic
- Azimuthal
Cylindrical projections are commonly used for world maps, while conic projections are preferred for mid-latitude regions, and azimuthal projections are well-suited for polar areas, each type having its unique characteristics and suitability for specific applications.
Popular Map Projection Methods
Several map projection methods have gained popularity due to their utility and ease of use.
- The Mercator projection, developed by Gerardus Mercator in the 16th century, is widely known for its use in navigation.
- The Robinson projection, introduced by Arthur H. Robinson in the 20th century, seeks to balance visual appeal and accuracy.
- The Gall-Peters projection, designed by James Gall and Arno Peters, aims to minimize area distortion.
Factors Influencing Map Projection Selection
When selecting a map projection, various factors must be considered:
- Purpose of the Map – The primary purpose for which the map will be used greatly influences the selection of a suitable projection. Different applications, such as navigation, thematic mapping, or spatial analysis, may require different projection characteristics. For example, a map designed for navigation may prioritize preserving direction, while a thematic map may prioritize preserving area or shape.
- Area of Coverage – The geographic extent of the mapped area constitutes another critical factor. Some projections better suit the mapping of small-scale areas, like continents or the entire globe, while others are more appropriate for mapping large-scale areas, such as individual countries or regions. Additionally, considering projections optimized for specific latitude zones or hemispheres based on the coverage area is advisable.
- Spatial Distortion Considerations – Map projections inherently introduce distortions in spatial properties, such as shape, area, distance, and direction. The choice of projection depends on prioritizing spatial properties deemed most important for the intended application. For instance, thematic mapping may prefer an equal-area projection to accurately represent spatial distributions, while navigation may opt for a conformal projection to preserve local angles and shapes.
- User Preferences – User preferences, including familiarity with certain projection types or aesthetic considerations, can influence the selection process. Cartographers and GIS professionals may have personal preferences based on their experience or training. Additionally, end-users of the map may have specific preferences or expectations regarding map appearance and readability.
- Data Compatibility – The compatibility of the chosen projection with existing datasets or data sources is essential. In GIS applications, datasets often come in various coordinate reference systems (CRS), and selecting a projection that aligns with the native CRS of the data can streamline data integration and analysis processes.
- Trade-offs and Compromises – No single map projection can perfectly preserve all spatial properties simultaneously. Therefore, selecting a projection involves making trade-offs and compromises based on the specific requirements of the application.

Understanding Map Projections
Map projections, despite their complexity, can be understood with clarity and ease by breaking down the key concepts and employing practical examples. Let’s explore some strategies for unravelling the mysteries of map projections and gaining a deeper understanding of their implications.
1. Start with the Basics
Understanding map projections begins with grasping the fundamental concepts behind them. Start by learning about the spherical shape of the Earth and how it poses challenges for representing its surface on flat maps. Explore the concept of latitude and longitude lines, and how they relate to the spherical coordinate system.
2. Explore Common Projection Types
Familiarize yourself with some of the most common map projections and their characteristics. For example:
- Mercator Projection
- Robinson Projection
- Lambert Conformal Conic Projection
3. Experiment with Interactive Tools
Take advantage of online interactive tools and software programs that allow you to explore different map projections in real-time. These tools enable you to visualize how distortion manifests across various projections and gain insights into their strengths and weaknesses.
4. Compare Real-World Examples
Examine real-world examples of map projections in action. Compare maps created using different projections and analyze how they distort geographic features differently. For instance, comparing a Mercator map with an equal-area projection like the Mollweide projection illustrates how landmasses are depicted differently in terms of size and shape
5. Understand Projection Properties
Gain an understanding of the properties that map projections aim to preserve, such as area, shape, distance, and direction. Recognize that no single projection can accurately preserve all these properties simultaneously, and trade-offs must be made depending on the intended use of the map.
6. Learn from Experts
Seek guidance from experts in the field of cartography and geographic information science. Attend workshops, webinars, or conferences focused on map projections and spatial analysis to learn from professionals with hands-on experience.
7. Practice Spatial Literacy
Develop your spatial literacy by regularly interpreting and analyzing maps from various sources. Pay attention to how different projections affect your perception of spatial relationships and geographic phenomena.
In conclusion, map projections play a crucial role in translating the three-dimensional surface of the Earth onto two-dimensional maps, facilitating navigation, communication, and spatial analysis. However, the complexities inherent in representing a curved surface on a flat plane inevitably lead to distortions in certain map properties.
Despite their limitations, map projections remain indispensable tools for understanding and interacting with our planet’s diverse landscapes, cultures, and resources. By understanding the principles behind map projections and their implications, individuals can make informed decisions when interpreting maps and conducting spatial analysis.
As technology continues to evolve, so too will the methods and tools available for creating and analyzing maps. With advancements in geospatial technology, including interactive mapping platforms and sophisticated projection algorithms, the future holds promise for more accurate, customizable, and accessible map projections.


Why are Map Projections so Confusing?