A digital elevation model is a representation of the bare ground topographic surface of the earth exclusive of trees, buildings and other objects on the earth’s surface. Digital elevation models are extracted from sources such as topographic maps, high-resolution LiDAR (Light Detection and Ranging) or IfSAR (interferometric Synthetic Aperture Radar). However, LiDAR and IfSAR techniques, are replacing topographic maps systematically in deriving digital elevation models.
The ifSAR technique is a radar mapping technology used to collect data about the terrain. It is the most effective method since it collects data under challenging conditions such as cloud cover, extreme weather conditions, rugged terrain, and remote locations. Moreover, radar technology is independent of darkness, therefore it can collect data during the night, unlike other techniques which depend on the concept of passive remote sensing, meaning that they have to depend on the sun’s electromagnetic radiation for data collection.
An example of ifSAR technology is the Shuttle Radar Topography Mission (SRTM) which obtains consistent, high-quality elevation data at the near-global scope. This article focuses on illustrating how to derive a digital elevation model and plot it using data from SRTM Version 4 in Google Earth Engine.
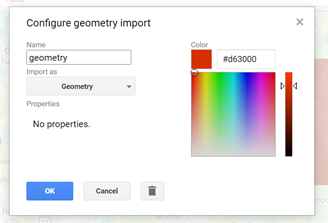
Select an area of interest.
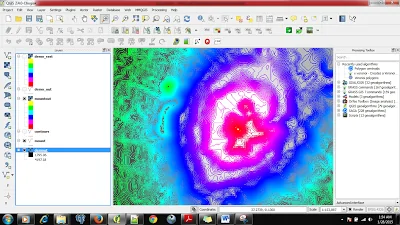
First, choose an area of interest using the geometry tool. Mt. Rainer is the area of interest.
Select an Image.
Secondly, choose an image from SRTM Version 4 dataset.
var elevation = ee.Image('CGIAR/SRTM90_V4');
Plot elevation at waypoints along the Area of Interest.
Thirdly, plot a set of points along the mountain each at a different elevation.
var waypoints = [
  ee.Feature(
      ee.Geometry.Point([-121.7353, 46.78622]),
      {'name': 'Paradise Ranger Station'}),
  ee.Feature(
      ee.Geometry.Point([-121.72529, 46.8093]), {'name': 'Pebble Creek'}),
  ee.Feature(
      ee.Geometry.Point([-121.72585, 46.8102899]),
      {'name': 'Start of Glacier'}),
  ee.Feature(
      ee.Geometry.Point([-121.7252699, 46.81202]), {'name': 'Glacier Point 1'}),
  ee.Feature(
      ee.Geometry.Point([-121.72453, 46.81661]), {'name': 'Glacier Point 2'}),
  ee.Feature(
      ee.Geometry.Point([-121.72508, 46.82262]), {'name': 'Little Africa'}),
  ee.Feature(
      ee.Geometry.Point([-121.7278699, 46.82648]), {'name': 'Moon Rocks'}),
  ee.Feature(ee.Geometry.Point([-121.73281, 46.8354]), {'name': 'Camp Muir'}),
  ee.Feature(ee.Geometry.Point([-121.75976, 46.85257]), {'name': 'Summit'})
];
var rainierWaypoints = ee.FeatureCollection(waypoints);
Create a chart.
Fourthly, create a chart to show the elevation of each waypoint in meters.
var chart = ui.Chart.image.byRegion({
  image: elevation,
  regions: rainierWaypoints,
  scale: 200,
  xProperty: 'name'
});
chart.setOptions({
  title: 'Mt. Rainier Summit Trail Elevation',
  vAxis: {
    title: 'Elevation (meters)'
  },
  legend: 'none',
  lineWidth: 1,
  pointSize: 4
});
Visualization
Next, print the chart in the console for visualization.
print(chart);

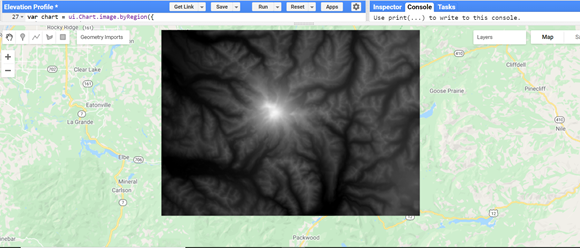
Display Final Results.
Finally, display the final results and compare them.
Map.addLayer(elevation.clip(geometry), {min: 500, max: 4500});
Map.addLayer(rainierWaypoints, {color: 'FF0000'});
Map.setCenter(-121.75976, 46.85257, 11);
Elevation profile for Mt. Rainier.
Elevation profile with Waypoints.
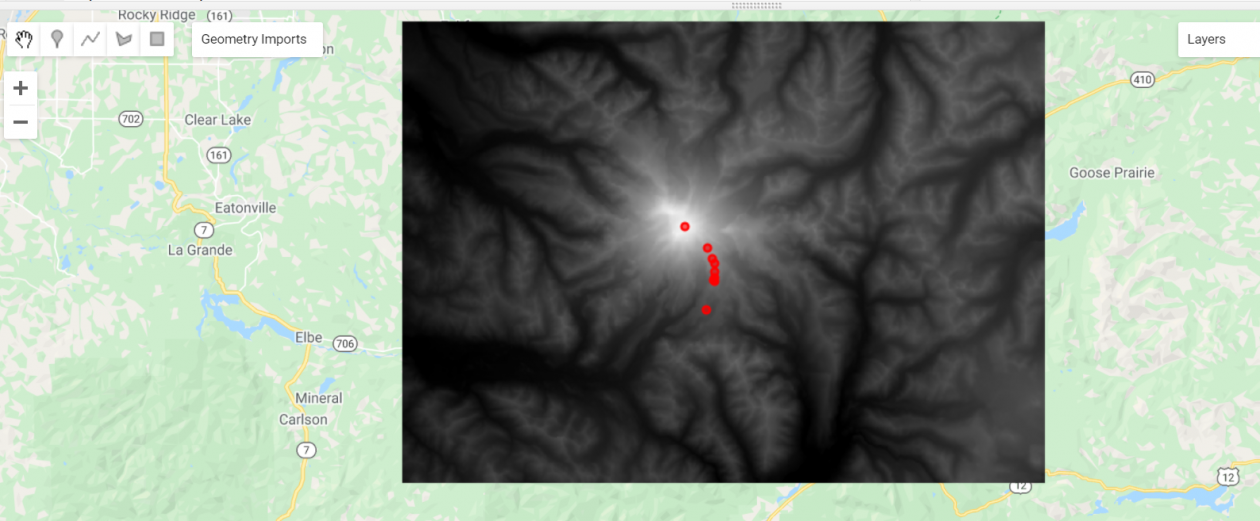
Inspect the result
Click on the highest waypoint to verify if the results correspond with the chart result.


Plotting a Digital Elevation Model profile in GEE