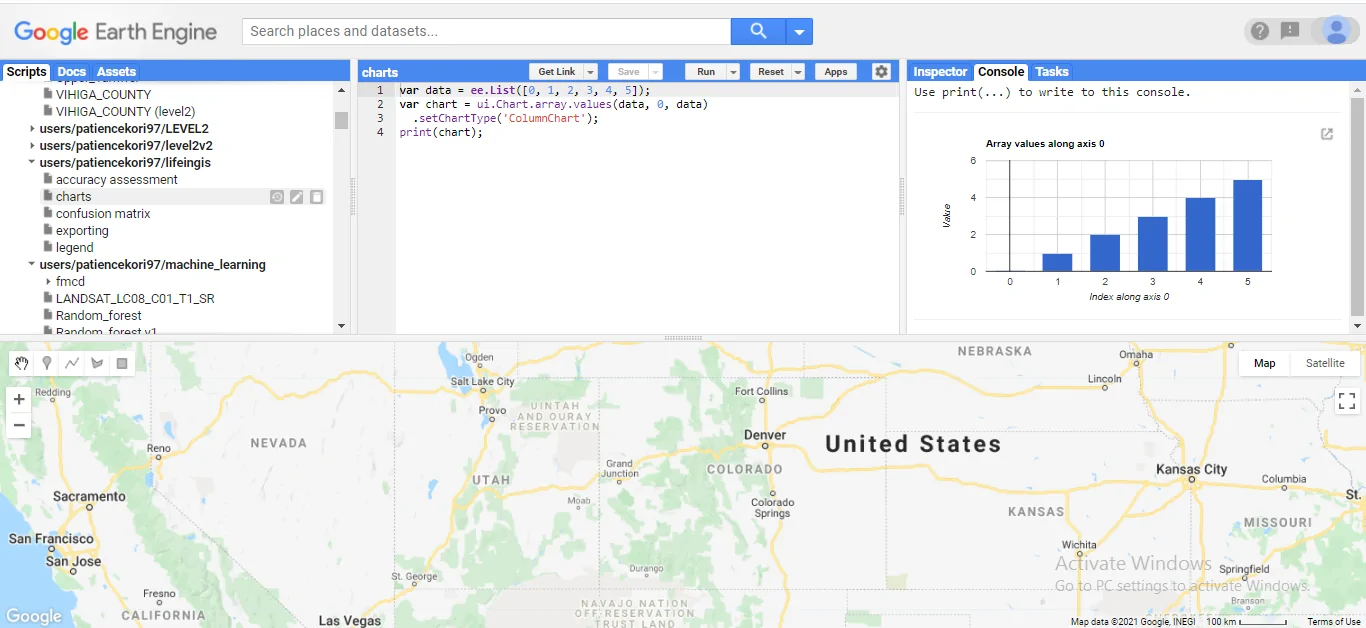
Charts are used to represent data. They can be in different forms; such as pie charts, bar charts, column charts, line charts, scatter plots, and histograms. This blog will show a simple code for the creation of a bar chart in Google Earth Engine (GEE).
var data = ee.List([0, 1, 2, 3, 4, 5]);
var chart = ui.Chart.array.values(data, 0, data)
  .setChartType('ColumnChart');
print(chart);
The result when the code is run is a bar chart as shown below:
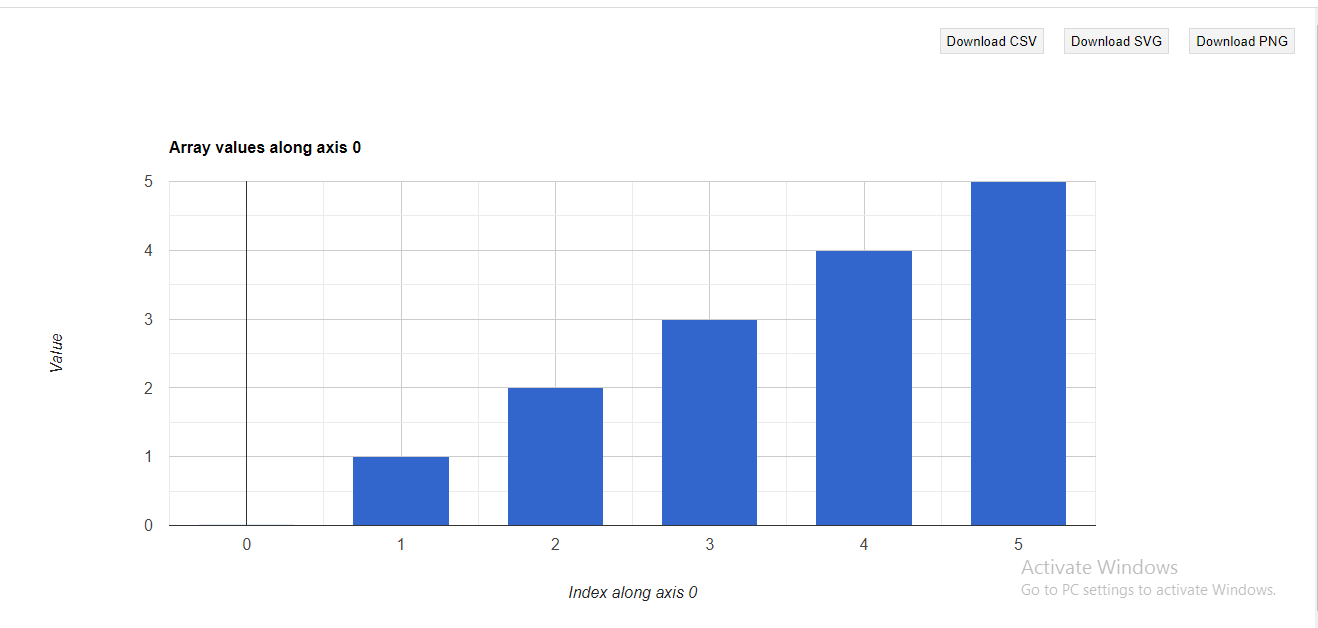
Clicking the arrow on the top right corner of the bar chart will enable downloading the chart in CSV, SVG, or PNG formats as shown below:


Creating charts in Google Earth Engine