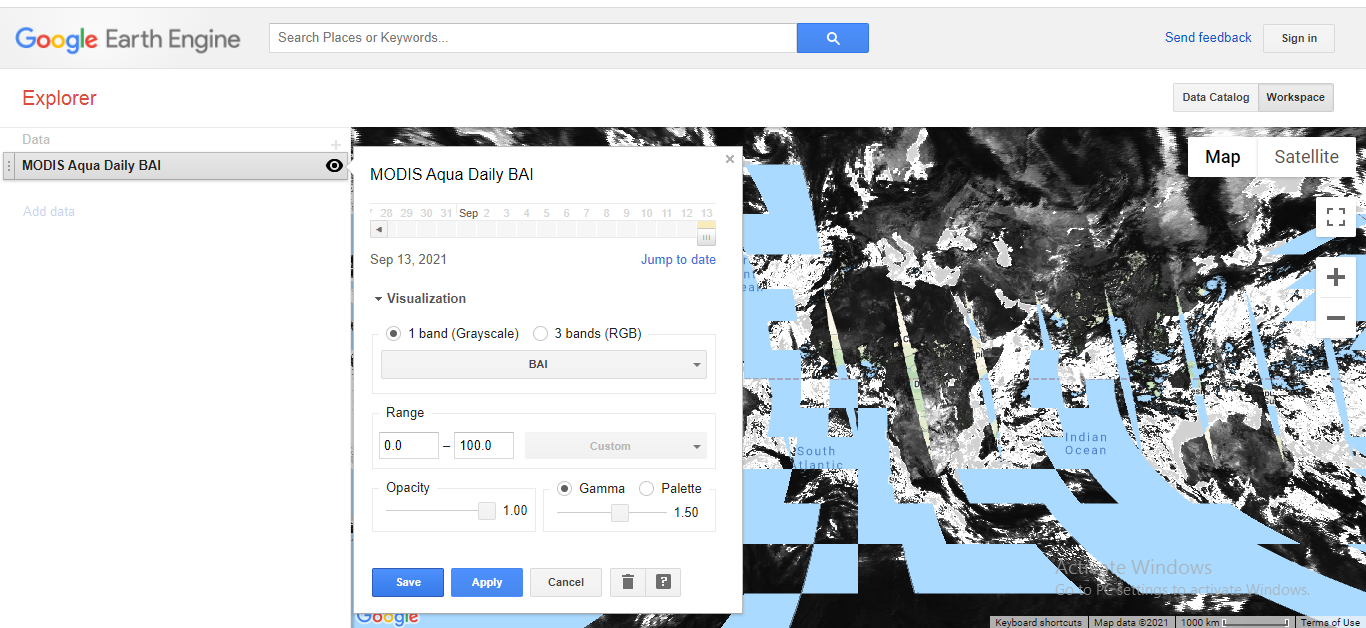
Visualization parameters enable a user to have a better view of the dataset. On the layers panel of the Modis dataset, there is a visualization dropdown within GEE. Clicking on the dropdown results in the image below:
In this GEE Explorer, layers can be visualized in a single band or three-band display. A single-band display is used for viewing a single continuous variable such as elevation or vegetation indices, while a three-band is used where each of three selected bands is assigned to gradients of RGB (Red, Green, and Blue).
The following is an illustration of the single band display, and it is achieved by clicking the 1 band (grayscale) button, whereas the three-band display is achieved by clicking the 3 bands(RGB) icon.
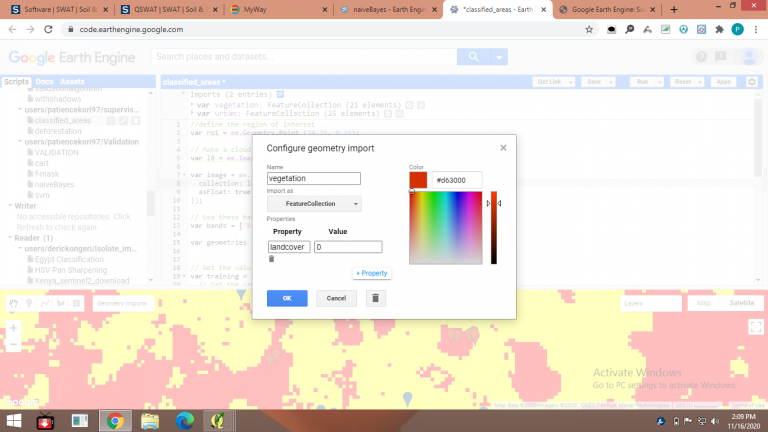
GEE Palette
The palette allows assigning of colours to the different bands in the layer. This can be done using the palette button at the bottom left corner of the settings panel, by clicking either the + icon or the pencil icon next to it as shown below:

The colours are added depending on the number of bands and can be removed using the – icon. In order to view the results, after making the changes, apply and save.
To read more about GEE, check out the content at this link


Visualization Parameters in GEE Explorer