Burn severity refers to the effects that fire intensity has on the functioning of an ecosystem in the area that has been burnt. It is the degree to which an ecosystem has been disturbed due to fire. The degree to which an area has been affected by the fire can be measured using the Normalized Burn Index (NBR) index which highlights burnt areas in large fire zones (severity mapping). This index is calculated using two bands, near-infrared (NIR) and short-wave infrared (SWIR). Healthy vegetation has high NIR reflectance while unhealthy vegetation has high SWIR reflectance. Similarly, areas that have burnt vegetation reflect SWIR the most. Burnt severity denoted by dNBR is determined by finding the difference between the pre-fire NBR and post-fire NBR. High values of dNBR indicate very severe damage while low values indicate a regrowth after the fire.
This article focuses on the burn severity mapping of Serengeti in Tanzania, an area prone to fire and classifies the burn severity into 7 classes as proposed by USGS.
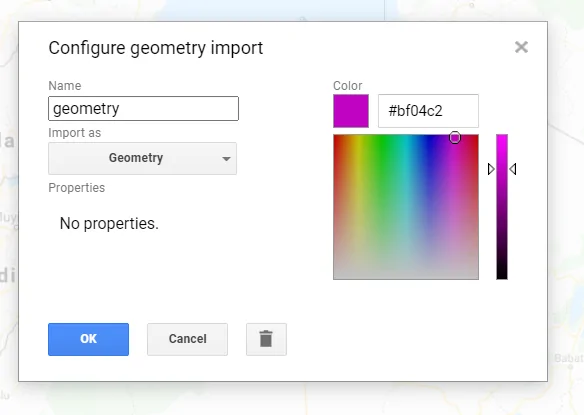
Select an area of interest (for the severity mapping)
- Select an area of interest using the geometry tool.
Set a Time Frame
Set start and end dates of a period before and after the fire. Make sure it is long enough for the platform to acquire an image.
var prefire_start = '2020-03-01';
var prefire_end = '2020-04-30';
var postfire_start = '2020-05-01';
var postfire_end = '2020-06-30';
Select A Satellite Platform
Select remote sensing imagery from two available satellite sensors keeping in mind their temporal resolution.
var platform = 'S2';
if (platform == 'S2' | platform == 's2') {
var ImCol = 'COPERNICUS/S2';
var pl = 'Sentinel-2';
} else {
var ImCol = 'LANDSAT/LC08/C01/T1_SR';
var pl = 'Landsat 8';
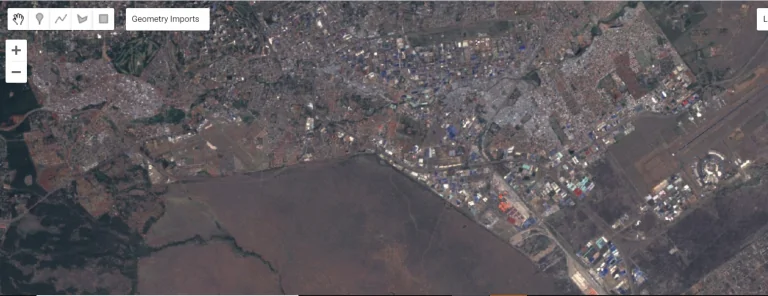
}Set The Area of Interest As The Map Center.
This is to set the map to your area of interest.
var area = ee.FeatureCollection(geometry);
Map.centerObject(area);
Select Sentinel Imagery By Time and Location.
Images will be collected in an Image Collection, depending on the area of study and the given time frame.
var imagery = ee.ImageCollection(ImCol);
var prefireImCol = ee.ImageCollection(imagery
    .filterDate(prefire_start, prefire_end)
    .filterBounds(area));
var postfireImCol = ee.ImageCollection(imagery
    // Filter by dates.
    .filterDate(postfire_start, postfire_end)
    // Filter by location.
    .filterBounds(area));
Apply A Cloud and Snow Mask On Both Landsat and Sentinel Images
The cloud mask is applied to the QA60 and pixel QA band for sentinel and Landsat images respectively.
function maskS2sr(image) {
  var cloudBitMask = ee.Number(2).pow(10).int();
  var cirrusBitMask = ee.Number(2).pow(11).int();
  var qa = image.select('QA60');
  var mask = qa.bitwiseAnd(cloudBitMask).eq(0)
      .and(qa.bitwiseAnd(cirrusBitMask).eq(0));
  return image.updateMask(mask)
      .copyProperties(image, ["system:time_start"]);
}
function maskL8sr(image) {
  var cloudShadowBitMask = 1 << 3;
  var cloudsBitMask = 1 << 5;
  var snowBitMask = 1 << 4;
  var qa = image.select('pixel_qa');
  var mask = qa.bitwiseAnd(cloudShadowBitMask).eq(0)
      .and(qa.bitwiseAnd(cloudsBitMask).eq(0))
      .and(qa.bitwiseAnd(snowBitMask).eq(0));
    return image.updateMask(mask)
      .select("B[0-9]*")
      .copyProperties(image, ["system:time_start"]);
}
if (platform == 'S2' | platform == 's2') {
  var prefire_CM_ImCol = prefireImCol.map(maskS2sr);
  var postfire_CM_ImCol = postfireImCol.map(maskS2sr);
} else {
  var prefire_CM_ImCol = prefireImCol.map(maskL8sr);
  var postfire_CM_ImCol = postfireImCol.map(maskL8sr);
}
Mosaic and Clip Images to Study Area.
This is important, especially if the collections created above contain more than one image.
var pre_mos = prefireImCol.mosaic().clip(area);
var post_mos = postfireImCol.mosaic().clip(area);
var pre_cm_mos = prefire_CM_ImCol.mosaic().clip(area);
var post_cm_mos = postfire_CM_ImCol.mosaic().clip(area);
Compute NBR for pre- and post-fire images
Apply platform-specific NBR for Landsat and Sentinel.
if (platform == 'S2' | platform == 's2') {
  var preNBR = pre_cm_mos.normalizedDifference(['B8', 'B12']);
  var postNBR = post_cm_mos.normalizedDifference(['B8', 'B12']);
} else {
  var preNBR = pre_cm_mos.normalizedDifference(['B5', 'B7']);
  var postNBR = post_cm_mos.normalizedDifference(['B5', 'B7']);
}
Calculate dNBR and Scale to USGS Standards
The difference between the normalized burn ratio pre-fire and post-fire is the dNBR.
var dNBR_unscaled = preNBR.subtract(postNBR);
var dNBR = dNBR_unscaled.multiply(1000);
Classify the dNBR Into Severity Classes
Define an SLD style of discrete intervals to apply to the image.
var sld_intervals =
  '<RasterSymbolizer>' +
    '<ColorMap type="intervals" extended="false" >' +
      '<ColorMapEntry color="#ffffff" quantity="-500" label="-500"/>' +
      '<ColorMapEntry color="#7a8737" quantity="-250" label="-250" />' +
      '<ColorMapEntry color="#acbe4d" quantity="-100" label="-100" />' +
      '<ColorMapEntry color="#0ae042" quantity="100" label="100" />' +
      '<ColorMapEntry color="#fff70b" quantity="270" label="270" />' +
      '<ColorMapEntry color="#ffaf38" quantity="440" label="440" />' +
      '<ColorMapEntry color="#ff641b" quantity="660" label="660" />' +
      '<ColorMapEntry color="#a41fd6" quantity="2000" label="2000" />' +
    '</ColorMap>' +
  '</RasterSymbolizer>';
Map.addLayer(dNBR.sldStyle(sld_intervals), {}, 'dNBR classified');
var thresholds = ee.Image([-1000, -251, -101, 99, 269, 439, 659, 2000]);
var classified = dNBR.lt(thresholds).reduce('sum').toInt();
Create a Legend and Add To Map
var legend = ui.Panel({
  style: {
    position: 'bottom-left',
    padding: '8px 15px'
  }});
 var legendTitle = ui.Label({
  value: 'dNBR Classes',
  style: {fontWeight: 'bold',
    fontSize: '18px',
    margin: '0 0 4px 0',
    padding: '0'
    }});
 legend.add(legendTitle);
var makeRow = function(color, name)
      var colorBox = ui.Label({
        style: {
          backgroundColor: '#' + color,
          padding: '8px',
          margin: '0 0 4px 0'
        }});

      var description = ui.Label({
        value: name,
        style: {margin: '0 0 4px 6px'}
      });
       return ui.Panel({
        widgets: [colorBox, description],
        layout: ui.Panel.Layout.Flow('horizontal')
      })};
 var palette =['7a8737', 'acbe4d', '0ae042', 'fff70b', 'ffaf38', 'ff641b', 'a41fd6', 'ffffff'];
 var names = ['Enhanced Regrowth, High','Enhanced Regrowth, Low','Unburned', 'Low Severity','Moderate-low Severity', 'Moderate-high Severity', 'High Severity', 'NA'];
for (var i = 0; i < 8; i++) {
 legend.add(makeRow(palette[i], names[i]));
  }
 Map.add(legend);
Display the Final Result.
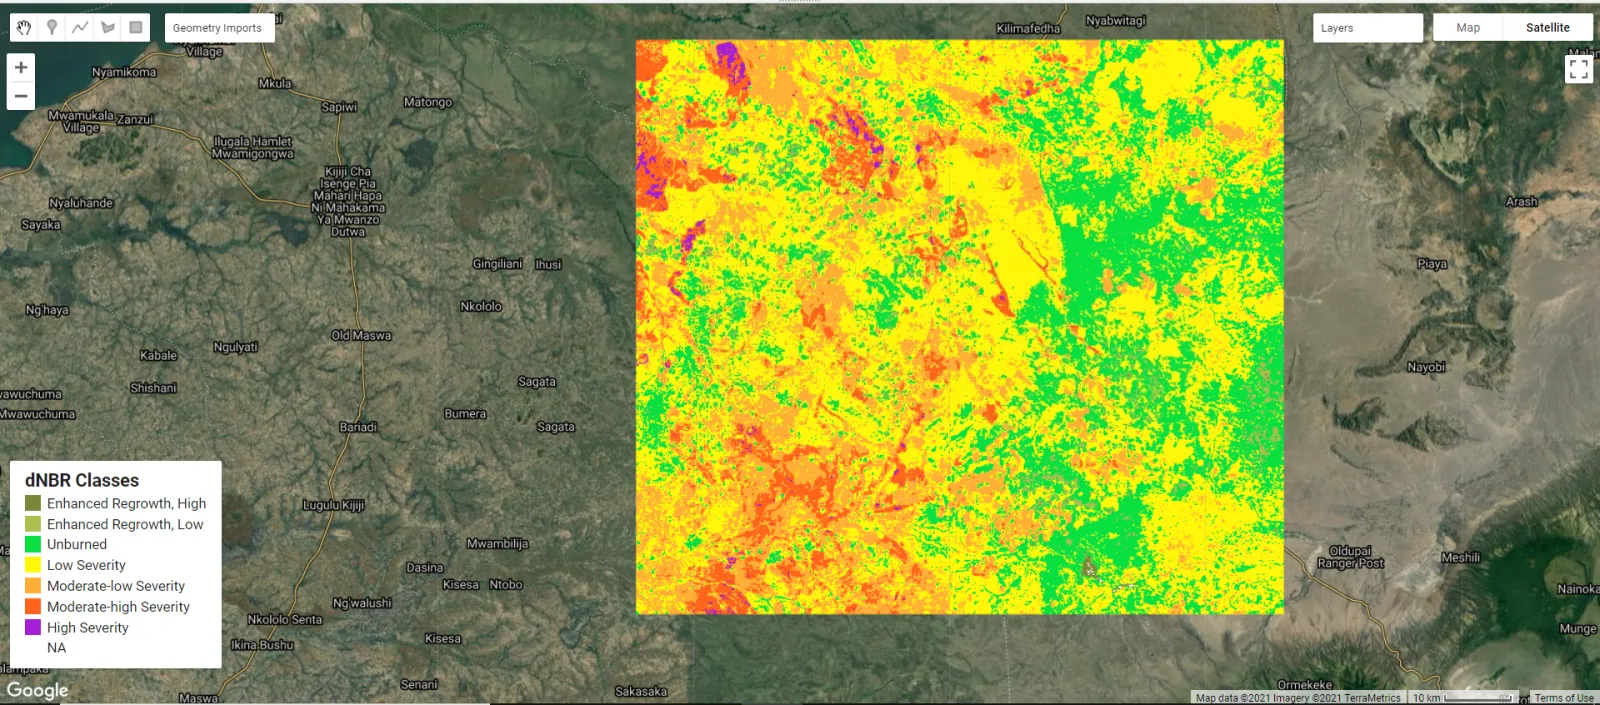
Burn severity mapping using Imagery